Mean-Reverting VIX: I · II · III · IV · V · VI
The thesis’ recipe, unchanged, against the full Cboe VIX option chain of 29 September 2026. Its central claim survives fifteen years. Its parameters describe a different market, and no single set of them describes the whole term structure.
Vol. IV rebuilt the thesis’ calibration and checked it against the thesis’ own tables. Now the out-of-sample test that a 2013 thesis can be given in 2026: same models, same quote filters, same loss, a market fifteen years younger. Everything below is regenerated by calibrate_2026.jl from a saved snapshot, and the full report is here.
the data
Cboe publishes delayed quotes for the whole VIX option chain as a free JSON feed. The snapshot used here was taken after the close on Tuesday 29 September 2026: 1,520 contracts across nine monthly and four weekly expiries, spot VIX 16.04 at 16:15 ET. It is saved in the repository with its SHA-256 (c404ecd5…ae5f9), so every number below can be regenerated.
As in the thesis, we keep the first four monthly expiries, calls only, with positive bid and positive open interest, and fit mid prices. Put–call parity (Vol. II) supplies the futures and the rate:
| Expiry | $\tau$ (years) | parity VIX future | calls used | mean open interest |
|---|---|---|---|---|
| 21 Oct 2026 | 0.060 | 17.59 | 55 | 76,129 |
| 18 Nov 2026 | 0.136 | 18.28 | 63 | 48,729 |
| 16 Dec 2026 | 0.213 | 18.67 | 58 | 22,400 |
| 20 Jan 2027 | 0.309 | 19.41 | 59 | 5,158 |
Rate 4.46%, contango, and a liquid market: the median bid–ask spread of these calls is 8.8% of the mid. The 2011 market was the mirror image: VIX at 42.3 in backwardation.
does the thesis survive?
| percentage error | prices inside bid–ask | |||||
|---|---|---|---|---|---|---|
| Expiry | MRLR | MRLRJ | MRLRSV | MRLR | MRLRJ | MRLRSV |
| Oct 26 | 37.9% | 1.9% | 1.6% | 18% | 100% | 100% |
| Nov 26 | 29.5% | 2.7% | 2.8% | 21% | 98% | 98% |
| Dec 26 | 30.6% | 2.3% | 2.4% | 22% | 98% | 98% |
| Jan 27 | 28.3% | 2.4% | 2.4% | 22% | 93% | 92% |
| thesis, 2011 | 4.7–6.9% | 3.1–5.2% | 3.0–5.1% | not reported | ||
Yes. The ranking is the thesis’ ranking, and the gaps are wider. Log-normal MRLR misses by 28–38% and prices only a fifth of the quotes inside the spread; the 2026 skew is simply steeper than the 2011 one. MRLRJ and MRLRSV fit better than they did in 2011, put 92–100% of prices inside the spread, and are tied with each other, exactly as the thesis found. “Inside the spread” is the stricter test: a percentage error can hide a systematic miss, but a model price between the bid and the ask is a price nobody in the market would dispute.
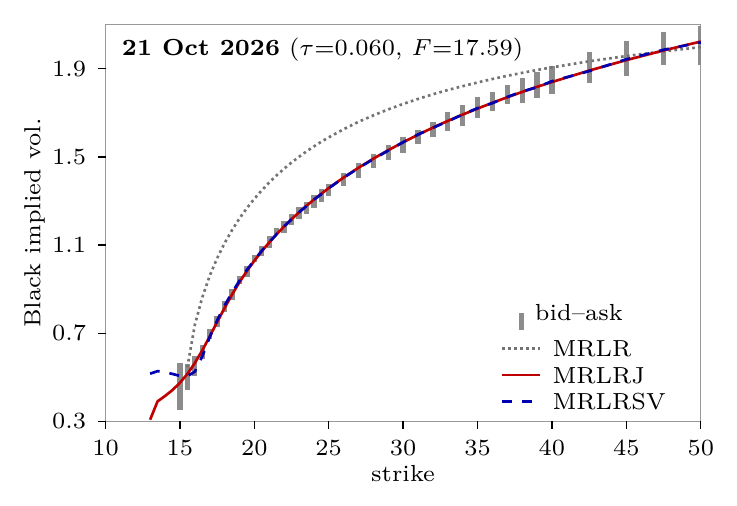
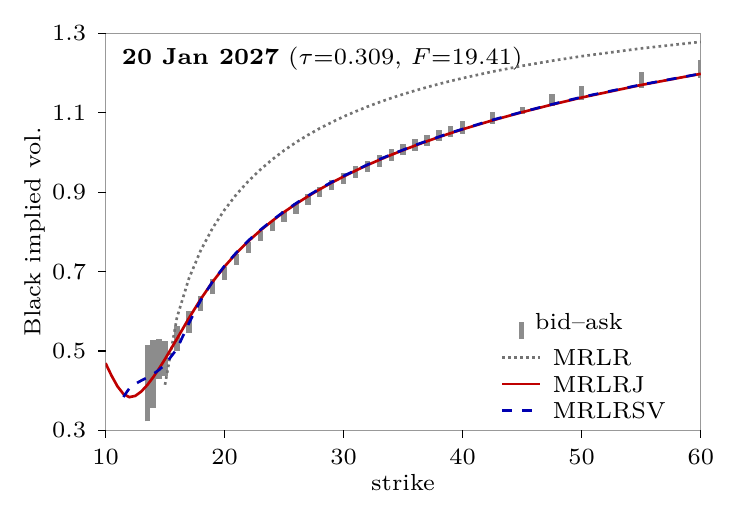
Implied volatility against the parity future, nearest and farthest maturities. Grey bars: bid–ask. MRLRJ (red) and MRLRSV (dashed blue) sit on top of each other and inside the bars. MRLR (dotted) is flat against its own future, which is 27–30% too low, so against the market's future its curve is misplaced.
held-out strikes
A five-parameter model fitting 55 prices might be memorizing them. Refit on the strikes of odd rank only and price the ones it never saw:
| Expiry | MRLR | MRLRJ | MRLRSV |
|---|---|---|---|
| Oct 26 | 39.6% | 1.9% | 3.5% |
| Nov 26 | 30.2% | 2.6% | 2.6% |
| Dec 26 | 31.9% | 2.2% | 2.2% |
| Jan 27 | 29.3% | 4.7% | 3.2% |
Out-of-sample errors on held-out strikes are almost the in-sample ones. The models interpolate the smile; they are not fitting noise.
the future nobody asked about
The thesis’ procedure uses the spot VIX as the starting value and never looks at VIX futures, which the thesis itself flags as a weakness (its Section 7.3.2; Vol. II explained why). So compare each fitted model’s future, $\psi(-i)$, with the parity future it was never shown:
| Expiry | market | MRLR | MRLRJ | MRLRSV |
|---|---|---|---|---|
| Oct 26 | 17.59 | 12.80 (−27%) | 17.59 (0.0%) | 17.58 (0.0%) |
| Nov 26 | 18.28 | 12.76 (−30%) | 18.30 (+0.1%) | 18.26 (−0.1%) |
| Dec 26 | 18.67 | 13.14 (−30%) | 18.69 (+0.1%) | 18.64 (−0.1%) |
| Jan 27 | 19.41 | 14.22 (−27%) | 19.42 (0.0%) | 19.40 (−0.1%) |
MRLRJ and MRLRSV recover the futures to 0.1% without being asked. They have to: a deep in-the-money call is worth about $D(F - K)$, so the bottom of the strike range pins $F$, and the free $\theta$ of each maturity moves the model’s level to match it. MRLR does not. It cannot fit both the level and the steep right tail with a flat smile, and the log part of the loss weights the tail heavily, so it gives up the level. The weakness the thesis worried about is real, but only for the model that was going to lose anyway.
what the parameters say
Here is every parameter, for the record (values pressed against a bound marked †):
| Oct 26 | Nov 26 | Dec 26 | Jan 27 | |
|---|---|---|---|---|
| MRLR $(\kappa,\theta,\sigma)$ | 88.5, 2.35, 8.35 | 19.6, 2.17, 5.15 | 0.265, −8.15, 1.99 | 0.325, −2.68, 1.69 |
| MRLRJ $(\kappa,\theta,\sigma)$ | 9.29, 2.76, 0.353 | 0.015, −15.0, 0.263 | 0.014, −18.7, 0.265 | 0.009, −23.3, 0.202 |
| MRLRJ $(\lambda,\eta)$ | 5.23, 3.29 | 2.93, 3.45 | 2.38, 3.42 | 2.11, 3.54 |
| MRLRSV $(\kappa,\theta,\rho)$ | 29.1, 2.86, 0.93 | 3.48, 2.98, 0.75 | 2.07, 3.00, 0.71 | 7.13, 2.90, 0.99 |
| MRLRSV $(\kappa_v,\theta_v,\sigma_v,V_0)$ | 1.31, 13.6, 14.5, 1.74 | 0.20, 0†, 5.39, 0.92 | 0†, 0†, 3.48, 0.75 | 0.16, 0†, 3.17, 1.77 |
Read with the warning of Vol. IV in mind. MRLR’s numbers are points on a flat ridge, and the ones it found are absurd: a reversion speed of 88 and a vol-of-vol of 8 in October, the only way a log-normal can make a far tail at all. MRLRJ’s October fit looks sensible; the next three slide down the ridge to $\kappa\approx0.01$, where the model has stopped mean-reverting. In MRLRSV the variance process loses its own mean reversion at three maturities ($\kappa_v$, $\theta_v\to 0$). What is stable across maturities is the jump shape: $\eta$ between 3.3 and 3.6 every time.
a different fear
The parameters that are pinned down have moved a long way since 2011.
| 2011 (thesis) | 2026 (October fit) | |
|---|---|---|
| spot VIX | 42.3 | 16.04 |
| jump rate $\lambda$ | 60–170 per year | 5.2 per year |
| mean log-jump $1/\eta$ | 0.10–0.15 (VIX +11–16%) | 0.30 (VIX +35%) |
| diffusion $\sigma$ | 1.5–3.0 | 0.35 |
| MRLRSV vol-of-vol $\sigma_v$ | 0.57–1.98 | 3.2–14.5 |
In 2011, a panicked market already at 42 needed its jumps to be frequent and small: something close to extra diffusion. In 2026 the market is calm, with a small diffusion, and the smile is carried almost entirely by rare, large jumps: about 0.3 of them expected before the October expiry, each adding a third to the VIX. The stochastic-volatility model can only mimic that with vol-of-vol three to seven times the 2011 values. That is why the first MRLRSV bounds I tried ($\sigma_v\le5$) had to be widened: the 2026 short-dated smile does not fit inside them.
Is that fear overpriced? The jump rate itself is too fragile to compare with history – it moves along the ridge from one maturity to the next – so compare something model-free. The slope of the call price in the strike gives the option-implied probability that the VIX finishes above $K$: $\mathbb Q(\text{VIX}_T > K) = -\frac{1}{D}\frac{\partial C}{\partial K}$. History gives the real-world frequency: of the 1,667 days since 2004 when the VIX stood between 14 and 18, how often was it above $K$ sixteen trading days later (script)?
| VIX on 21 Oct above | options ($\mathbb Q$) | MRLRJ ($\mathbb Q$) | history ($\mathbb P$) | $\mathbb Q/\mathbb P$ |
|---|---|---|---|---|
| 20 | 11.5% | 11.9% | 13.5% | 0.9 |
| 25 | 5.0% | 5.2% | 3.5% | 1.4 |
| 30 | 2.8% | 2.7% | 1.4% | 1.9 |
The options price a modest rise (to 20) about as often as history delivers it, and price a spike to 30 about twice as often. The fear premium lives in the far tail, which is where the jumps are. Two cautions: the historical 30+ outcomes are about two dozen overlapping days from a handful of episodes, and this is one day’s chain. It is a measurement, not yet a strategy; Vol. VI takes it from there.
one model, four maturities
Every fit so far is one expiry with its own parameters. A model of how the VIX moves should explain all four expiries with one set. The thesis’ own recommended strategy (its Theorems 3.3, 4.4 and 5.4) does this in two stages: choose the dynamics, then set $\theta$ for each maturity so that the model future matches the market’s. That second stage is exact, since $\theta$ enters $\ln F$ linearly. So fit one parameter set to all four expiries at once, with $\theta$ anchored per maturity:
| Oct | Nov | Dec | Jan | inside spread | |
|---|---|---|---|---|---|
| MRLR | 95.0% | 81.0% | 71.5% | 68.7% | 9% |
| MRLRJ | 12.6% | 6.8% | 5.3% | 6.3% | 52% |
| MRLRSV* | 16.1% | 12.1% | 29.0% | 31.1% | 35% |
*The joint MRLRSV fit hit its time limit, so its errors are an upper bound. The gap to the per-maturity fits is far larger than any plausible optimizer slack.
The per-maturity success does not carry over. The best model, MRLRJ with $\kappa = 1.2$, $\sigma = 0.47$, $\lambda = 2.3$, $\eta = 3.1$, prices only half the quotes inside the spread. A constant-parameter mean-reverting log model can fit any one VIX smile; it cannot fit four of them together. The thesis half-anticipates this by letting $\sigma_t$ vary with time, but a vol-of-vol that changes per maturity is per-maturity calibration again, in a different coat.
the March chain, re-checked
The March post’s live test used a chain scraped on the weekend of 7–8 March 2026: weekly VIX calls expiring 25 March, quotes from the Friday close, spot VIX 29.49 – the day the VIX had jumped 24%. No puts were saved, so there is no parity future; the rate is the script’s 4.5%. Re-running the thesis’ procedure on it (script):
| 6 Mar 2026, 38 calls | percentage error | model future |
|---|---|---|
| MRLR | 19.1% | 22.10 |
| MRLRJ | 2.8% | 24.83 |
| MRLRSV | 3.3% | 24.77 |
where this goes
The scorecard: the thesis’ central claim survives a new market; the jump and vol-of-vol models are excellent one-expiry smile fitters; their parameters are mostly not measurements; the 2026 market prices rare large spikes about twice as often as history delivers them; and no constant-parameter model spans the term structure. The March post turned all of that into five trading strategies. Vol. VI puts each one against these results.
Next: Vol. VI: Trading It, Honestly
Mean-Reverting VIX: Vol. I · Vol. II · Vol. III · Vol. IV · Vol. V · Vol. VI